Note: Inspect CLI is a commercial product that requires an Inspect Pro or Inspect Teams subscription.
Installation
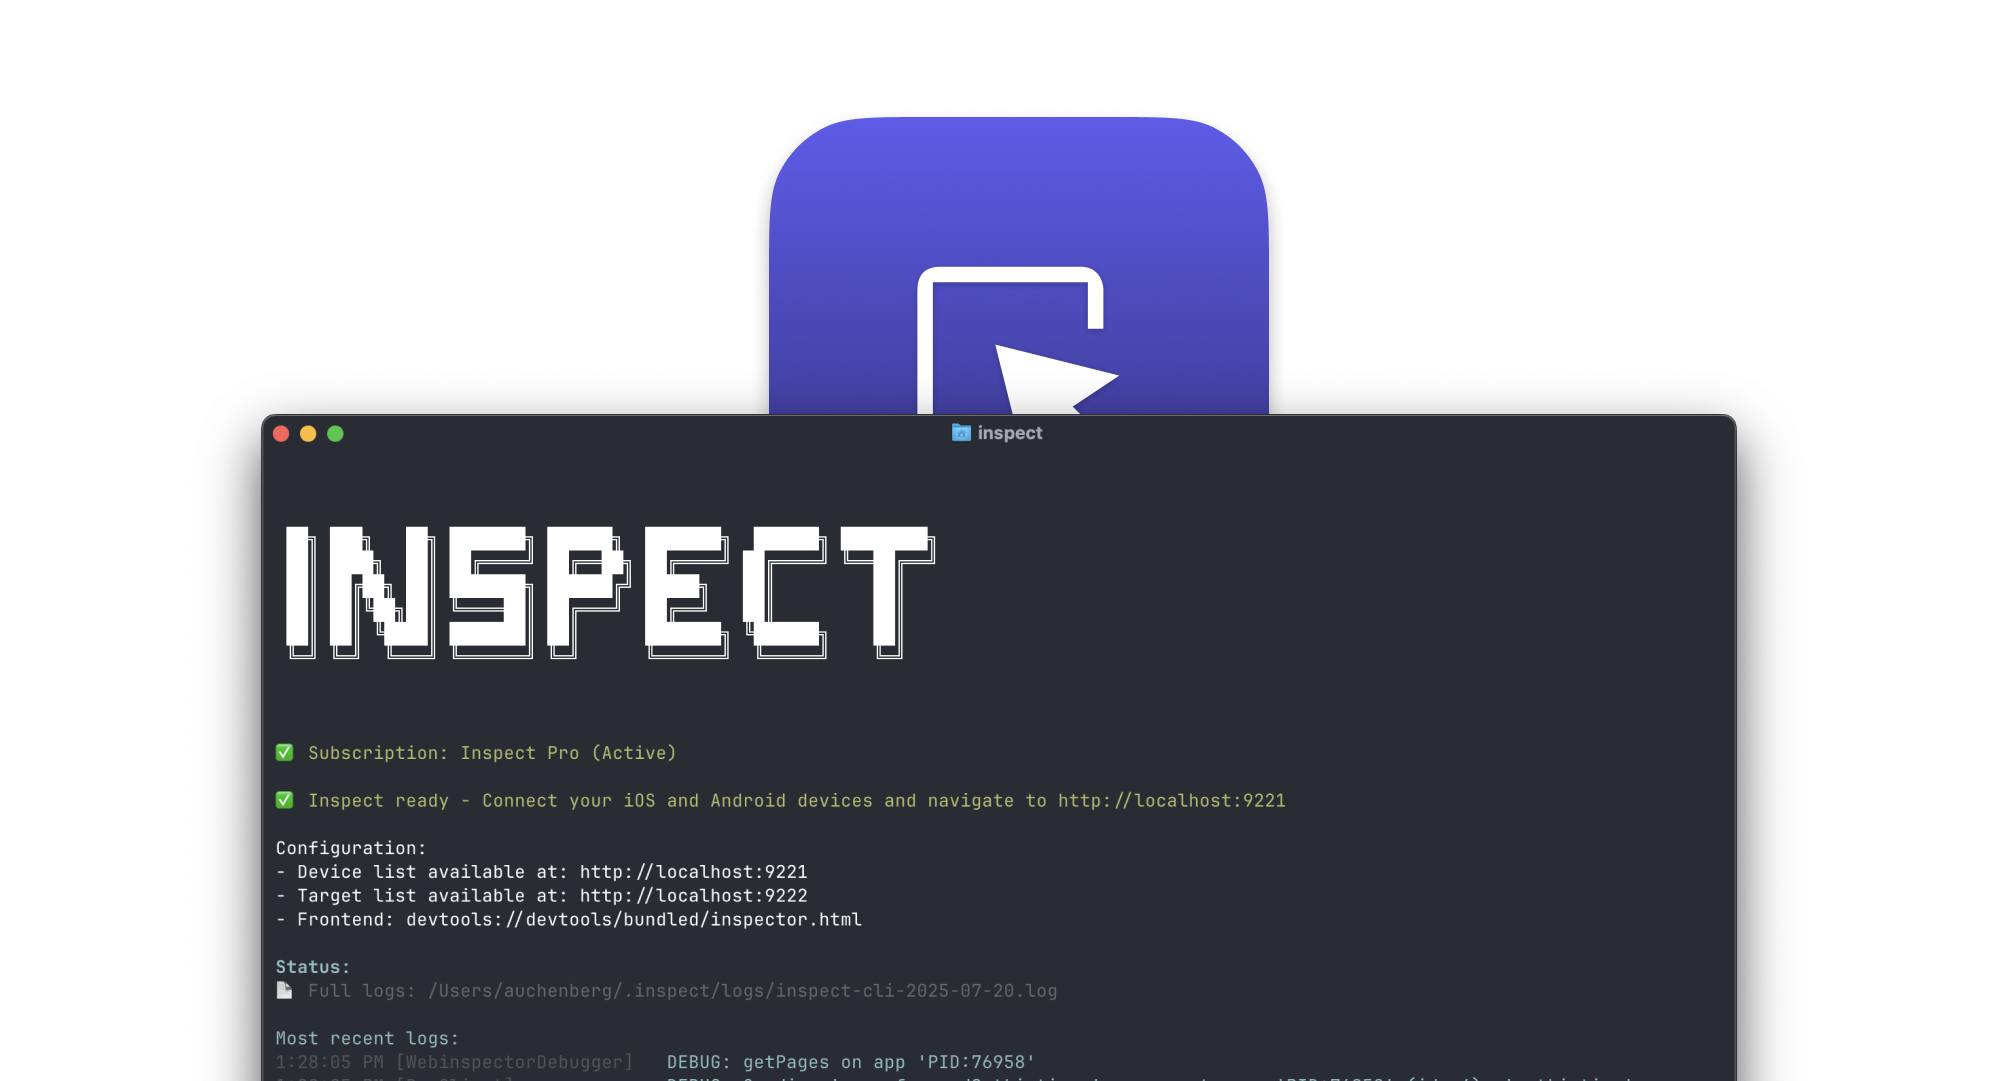
📱 What is Inspect CLI?
Key Features:- 🔍 Debug iOS websites and WebView with Chrome DevTools
- 🔐 Discovery of iOS Simulators
- 📱 Automatic device discovery and connection
- ⚡ Fast setup - works in seconds
📋 System Requirements
- Node.js: 16 or higher
- OS: Works on MacOS, Windows and Linux.
- iOS Devices: iOS 12+ with Web Inspector enabled
🔐 Authentication
Before using Inspect CLI, you need to authenticate with your inspect.dev account:📖 Usage
Basic Usage
Advanced Configuration
📋 Command Reference
Commands
| Command | Description |
|---|---|
inspect login | Login to inspect.dev using OAuth |
inspect logout | Logout from inspect.dev |
inspect | Start the debug server |
Options
| Option | Short | Description | Default |
|---|---|---|---|
--ports | -p | Port assignment configuration | 9221,9222 |
--frontend | -f | Frontend source URL or path | devtools://devtools/bundled/inspector.html |
--device-id | -d | Filter to specific device ID | |
--debug | Enable verbose output | false | |
--help | Show help | ||
--version | Show version |
🔌 Getting Started
1. Connect Your Device
For iOS:- Connect iPhone/iPad via USB
- Enable Web Inspector: Settings → Safari → Advanced → Web Inspector
- Trust your computer when prompted
2. Start Inspect
3. Open DevTools
- Visit http://localhost:9221 to see connected devices
- Click on your device to see available apps
- Click on an app to open Chrome DevTools
🔧 Configuration
Port Configuration
By default, Inspect CLI uses ports 9221 and 9222:- 9221: Device list server
- 9222: Debug target server
Custom DevTools Frontend
Use a different DevTools frontend:🐛 Troubleshooting
Common Issues
“Not authenticated” error:- Ensure Web Inspector is enabled in Safari settings
- Try disconnecting and reconnecting the USB cable
- Check that you’ve trusted the computer